CronDoctor Caught Its Own Bug After I Went to Bed
I woke up to 5 emails from my own product. Not spam. Not marketing drip. Five real alerts from CronDoctor telling me that CronDoctor itself was having a bad time.
Why I built this thing
I have a remote telescope in the middle of Texas at Starfront Observatories. Every night, a chain of scheduled jobs kicks off. The mount slews to target, the camera starts an imaging sequence, the guider locks on, and hours later a post-processing pipeline crunches the data. Any one of those steps can fail silently. The mount doesn't home. The guider loses its star. The cooling system doesn't reach temperature. And I'm 200 miles away, asleep, with no idea that I just lost an entire night of clear sky.
That's how CronDoctor started. I needed something that would catch those silent failures, tell me what went wrong and how to fix it. Not just “it's down” at 3 AM. The telescope was the first use case. It's caught plenty of nights where equipment didn't start or the post-processing pipeline choked on bad data.
Turns out, developers and DevOps teams deal with the same thing. Backups stop running and nobody notices for days. Deploy scripts error out at 2 AM and the only evidence is a log file nobody reads. Monitoring tools will tell you “it's down” but won't tell you why, or what to do about it.
So I turned the telescope tool into CronDoctor. It reads your job's error output, runs it through AI, and tells you what went wrong and how to fix it. Instead of “your job failed,” you get “your job failed because the disk filled up during pg_dump, here's the command to free space.”
And of course, if you're going to build a monitoring tool, you'd better eat your own dog food.
The setup
CronDoctor monitors itself with two internal jobs. The first watches the compliance check engine, the core loop that evaluates all monitors every 60 seconds. The second watches the demo simulator, which keeps the live demo populated with realistic data. Both run every minute. Both report back to CronDoctor like any other monitored job.
Last night, they both had something to say.
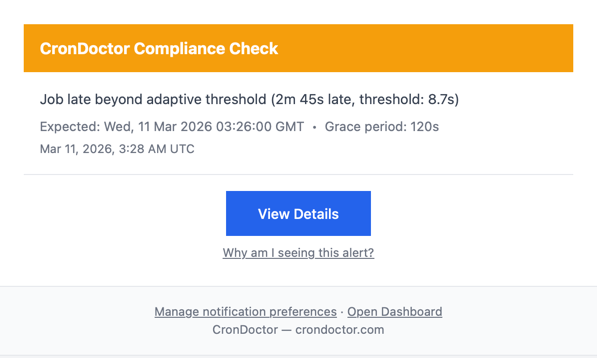
11:28 PM: the first warning
The compliance check came in late. Not a little late. 2 minutes and 45 seconds late, against an adaptive threshold of 8.7 seconds. CronDoctor tracks what's normal for each job over time, so it knew this wasn't just jitter. Something was actually wrong.
11:29 PM: two failures, two diagnoses
One minute later, both monitors reported failures with exit code 1. CronDoctor's AI diagnosed the root cause on both.
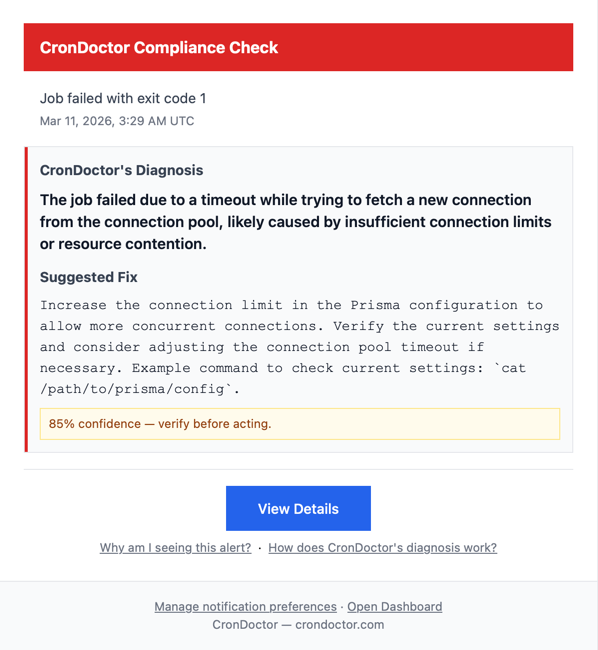
Both correctly identified the issue: a database connection pool timeout. The underlying database couldn't hand out connections fast enough. Same root cause, correctly diagnosed, 85% confidence.
But the suggested fixes were different.
The compliance check suggested “consider adjusting the connection pool timeout.” That's exactly what I wound up doing. I doubled the timeout from 10 seconds to 20.
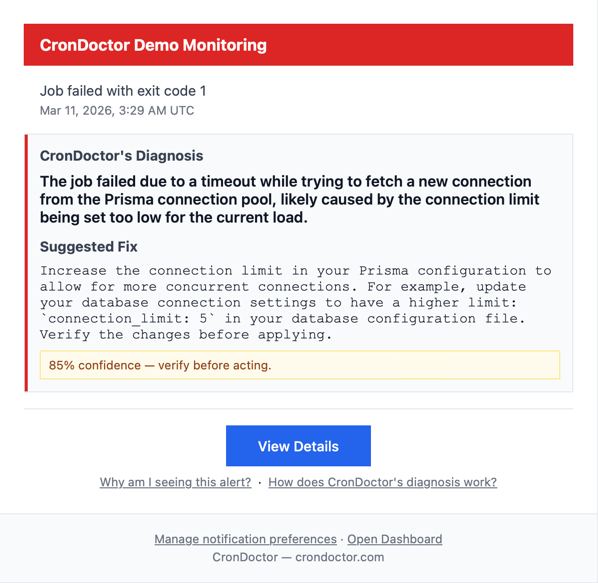
The demo monitor suggested “increase the connection limit to 5.” Reasonable advice in general, but wrong for my setup. I run on Vercel (serverless), where each function instance intentionally uses a single database connection. Bumping it to 5 would have made the problem worse.
This is why every diagnosis shows a confidence level and says “verify before acting.” The fix is a starting point, not a prescription. One suggestion was spot-on, the other needed context the AI didn't have. Still more useful than “your job failed” with zero context.
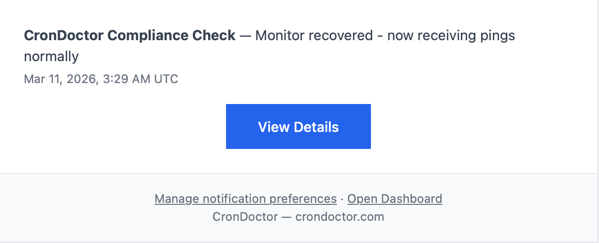
11:29 PM: recovery
Same minute, both monitors recovered and CronDoctor sent the all-clear. Transient issue. A burst of concurrent serverless functions competing for database connections during off-peak hours when cold starts pile up.
The fix
I added pool_timeout=20 to the database connection string, doubling the default window for acquiring a connection.
Deployed before breakfast.
The point
I didn't find this by checking logs or doing a routine review. Nobody complained. My own product just noticed something was wrong with itself and told me what to do about it.
The whole thing took about 60 seconds. The fix took about 5 minutes the next morning.
That's the whole point. That's why I built this thing.
I built CronDoctor because I was tired of waking up to failures nobody noticed. The fact that it caught its own bug while I slept is the whole point — your monitoring should work when you aren't. First job is free; $2/month each after that.
Start free